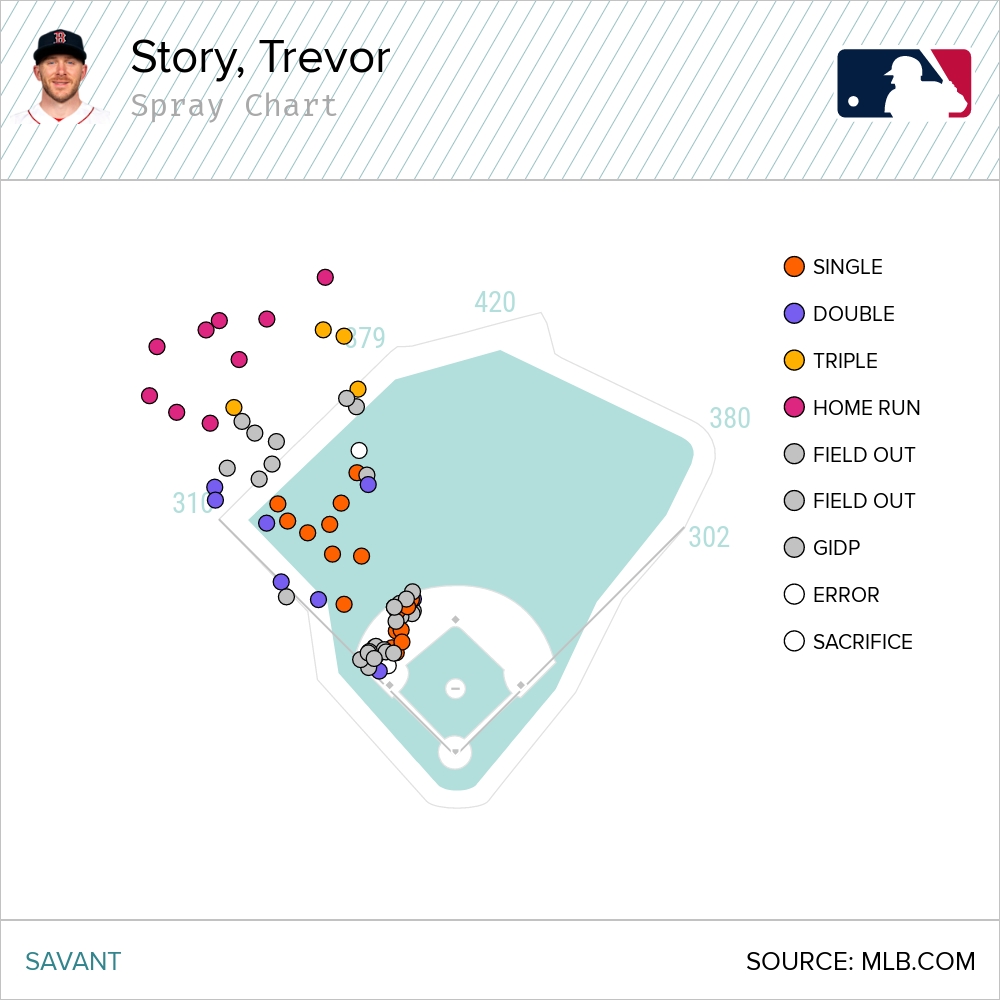
Ever since reports of the Boston Red Sox inking Trevor Story to a six-year, $140 million contract, you’ve seen this graphic circulating over social media.
Every Sox fan salivated at the prospect of those gray, white, and blue dots being turned cyan when his 2021 spray chart was overlapped onto the dimensions of Fenway Park. Outs became doubles, doubles and triples became homers. Story has just been released from the shackles of Coors Field. He is destined for greener pastures in Boston.
While this chart could give fans some insight into how Story will translate, there’s always room to dig deeper. How might Story’s career numbers be different if he had been a Red Sox member from the beginning of his career? In particular, how would Story have been affected by playing 81 games a year with the ol’ green monster in left field?

That question became a topic of discussion during a recent Red Sox Spring Training broadcast. Former Sox legend and “Greek God of Walks” Kevin Youkilis mention that part of Story’s success will be how he can handle pulling off-speed pitches at Fenway. Using the green monster helps accumulate hits, although it may subtract from a right-handed hitter’s home run total.
The Green Monster
Before we study Story, let’s get an idea of what it takes to launch a home run over the green monster. The monster sits 330 feet from home plate. A proper-handed batter would need to at the very least hit a ball with a 20-degree launch angle at an exit velocity of at least 107 mph. Since the Statcast era, the shortest home run hit by a right-handed hitter over the monster was by then Oakland Athletics Mark Canha, who in 2015 hit a ball 385 feet with a launch angle of 20 degrees that just cleared the beast. Unfortunately, we don’t have the footage for that. 2015 was eons ago.
The shortest home we have on cam came from Yoán Moncada in 2019. The distance was 390, and the launch angle was 22 degrees, just enough to clear that thang!
We’re going to go through each of Story’s seasons and look at his home spray chart of balls he pulled to see how many more home runs, doubles, and singles he could have played at Fenway Park instead of Coors Field.
2016

We can already see a lot of these gray dots far over the monster, but do they have the metrics to clear the green monstrosity? Of the six gray dots pictured beyond the wall, three of them would have the dimensions to become home runs. The rest of the grey and blue dots would have rattled off the monster to become hard-hit singles or doubles. Therefore, three extra homers would’ve bought Story’s 2016 total to an even 30.
2017

A whopping eight of these outs would have resulted in home runs this year, and one of his doubles would’ve been a home run pushing his 2017 total to 33, eclipsing his rookie year total. Two seasons, two 30 home run campaigns.
2018

This year sees Story adding about six more doubles to his total of 42. Many of the hits beyond the monster fell just short in the launch angle department, but Story knocking on the door of 50 doubles would have been amazing.
2019
This chart plays out as is pretty much. Story does have a triple that had the launch angle and exit velocity to get over the monster. Maybe those triples would’ve been turned to doubles and even perhaps singles.
2020

In the shortened 2020 season, potentially three extra doubles would’ve been added to the tally.
2021

More doubles! Seven more balls that ended up outs or sacrifices could’ve been turned to extra-base hits.
Pull, Pull, and More Pull?
Of course, we can’t know how Story’s offensive career would’ve been different had he been a Red Sox member from the jump. With these charts as evidence, would it behoove Story to become more pull dominant as a hitter?
Over his career, Story has been one of the more well-rounded hitters in terms of his spray chart. He is 36% pull, 37.3% straight, and 26.5% opposite field for his career. He isn’t just exclusive to one side of the field. On balls in play to the opposite area, Story was .312 in 2021. In addition, he was .286 on balls in play and .286 straightaway on balls he pulled.
It would suggest that Story may be best with this more holistic approach. Should he try and take advantage of the new scenery as much as possible with the monster present? Since 2015 righties at Fenway Park have a .384 BABIP compared to .298 straight away and .272 to the opposite field. The monster creates more hitting opportunities for righties.
In conclusion, Story has an opportunity to become a prolific doubles hitter in this new environment. A change in hitting philosophy (one that is more pull-centric) could make Story one of the MLB’s biggest weapons.
Expect pitchers to stay on the outside zone against Story. Righties as a whole are discouraged by pitchers from pulling the ball. Take a look at this attack chart of righties at Fenway from 2021.

Finally, here’s a little nugget for Red Sox fans; here’s an actual bomb from Story. This one lands on Lansdowne Street for sure:
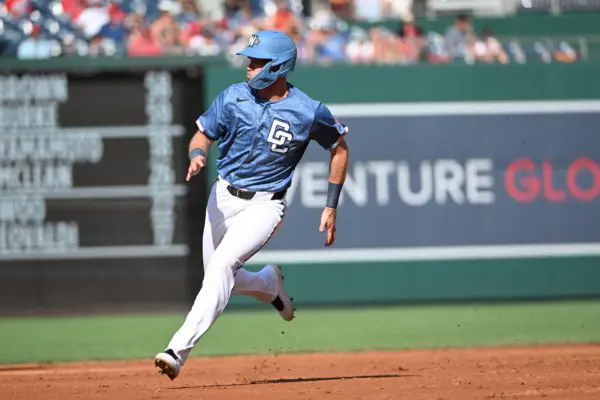
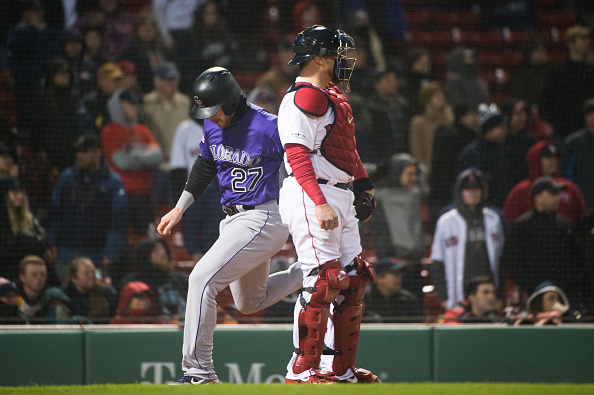
Main Image
Players Mentioned: