Yordan Alvarez has been the best hitter on the planet seemingly since debuting in 2019. But there is always one caveat that comes with that: “when healthy.” After signing as an International Free Agent with the Los Angeles Dodgers in 2016, he was quickly traded to the Houston Astros for whom he made his debut on June 9th, 2019. Since debuting, he has played in a total of 410 out of a possible 527 games. That gives him a Games Played Rate of 77.8%. Not ideal, but not as bad as some other “superstars.” Today, we project what the stats of a fully healthy Yordan Alvarez in 2020 would look like.
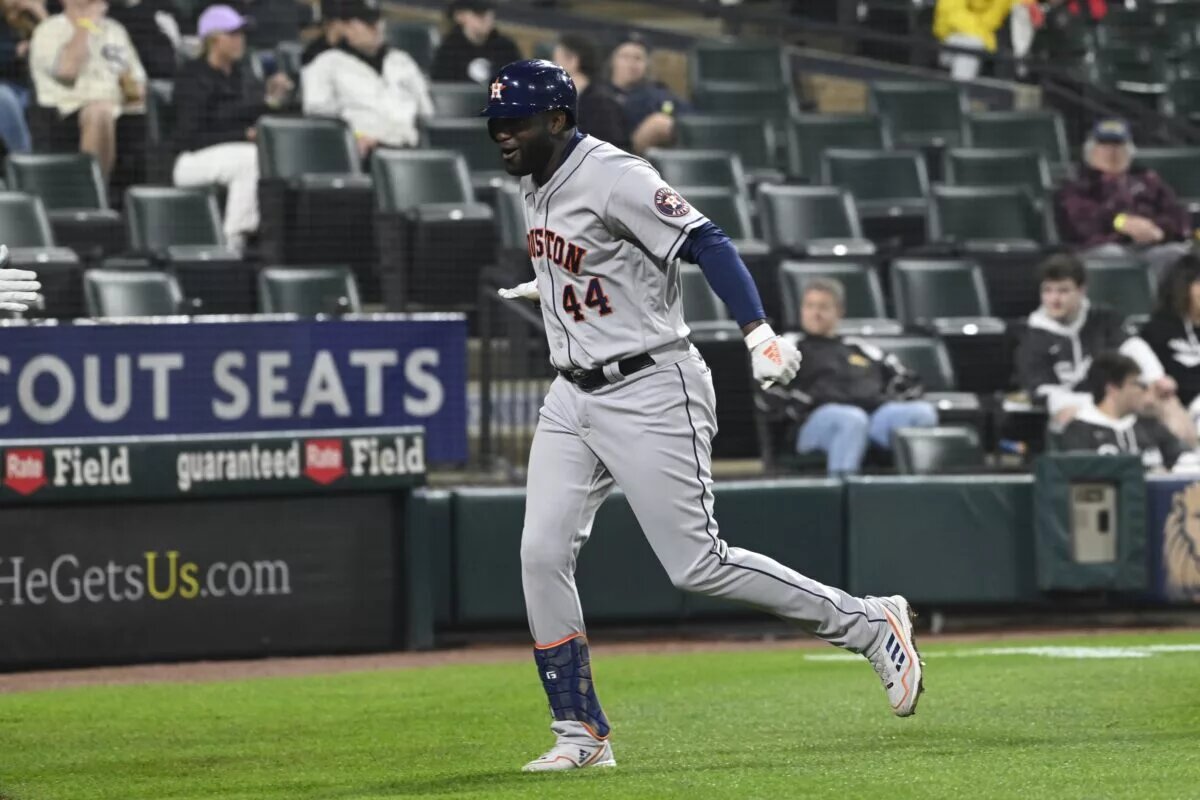
Yordan Alvarez may be the best overall hitter in baseball.
Definitely the scariest to pitch to. https://t.co/cGuLOtXbMy
— Ari Alexander (@AriA1exander) May 23, 2023
What A Healthy Yordan Alvarez In 2020 Looks Like
Laying The Ground Work
For the majority of this exercise, we will be using Yordan’s rate stats for 2020 and his career average rate stats. We will also try and factor in any regression to the mean that occurs, as rate stats generally stay around the same place over long periods. To calculate the number of games a healthy Yordan Alvarez would have played, I will be taking the average number of games played by each player that ranks above him in games played for the 2020 season. Without further adieu the COVID-shortened 2020.
A Healthy Yordan Alvarez In 2020
2020 was not kind to Yordan. He played in a total of two games out of a possible 60. It was not a sophomore season to write home about. In those two games, he went 2-8 with a home run, four RBI, and one HBP. This skews his rate stats, but that is something that we can work around. We will start by finding his new amount of games played. As you can imagine, two games played rank pretty low on the list. 560th to be exact. So once you add up the total number of games the 558 players ahead of him played, and take the average, you get a new total number of games of 34 (33.695). Everything else should be pretty straightforward, right? Wrong. It’s baseball. Nothing is ever straightforward. And that is why it is the most beautiful sport ever created.
First for the counting stats that would be pretty straightforward. Nine plate appearances over two games equate to 4.5 plate appearances per game. Over 34 games, that would give healthy Yordan Alvarez a total of 153 plate appearances. With eight of them being official at-bats, his new total of official at-bats comes to 136. Now it is time to dive into the formulaic weeds.
2020’s Rate Stats
Despite his batting average of .250, his BABIP (Batting Average On Balls In Play) was only .167 since one of his two hits was a home run, therefore not technically “in play.” His career BABIP, however, is a very nice .330. But to find how many balls he would have put in play, we need to eliminate the ones that would not be put in play. One home run every nine plate appearances has him on track for 17 home runs on the season. However, regression to the mean would most certainly come into play. His career home run rate is 6.6%, 2020’s was 11.1%. The average comes out to 8.85% which would give him a total of 14 (13.54) home runs. That gives him 122 at-bats to potentially put the ball in play. But wait! There’s more!
Strikeouts are yet another instance in which a ball does not go into play. Yordan is no stranger to the strikeout, although he does strikeout just below league average. One strikeout in nine plate appearances in 2020 gives him another rate stat of 11.1%. His career strikeout rate being 22.5%, means that the average would be 16.8%. This gives healthy Yordan Alvarez a new strikeout total of 26 (25.7). We now have 96 at-bats to work with.
You’re probably wondering, “Well what about plate appearances?” and for that, we need to move to walks! Yordan is one of the preeminent walkers in the game today with a career rate of 11.8%. No walks in 2020? No problem! 11.8% divided by two is 5.9%. That gives him nine (9.027) walks on the hypothetical season with eight other plate appearances to account for. Those we will split evenly between hit-by-pitches and sacrifice flies.
Playing The Hits
96 at-bats to go. Everything remaining will be put into play in one way or another. Just how many of those balls will be hits? 24 (23.856) would of them would go for hits, giving him a batting average of .279, to go along with an on-base percentage of .333. For those of you keeping score at home, that OBP lines up exactly with his actual OBP for 2020. But we still have a slugging percentage left to find. At the time of writing, Yordan has 1,719 career plate appearances. He has hit a total of three triples. It would be a safe assumption to say he would not have any in 2020. Doubles, on the other hand, account for 23% of his total career hits. That would give a healthy Yordan Alvarez nine (8.74) doubles in 2020.
The Final Line For A Healthy Yordan Alvarez In 2020
Now that all of the math is done for 2020, it’s time to present the complete results. In 2020, a healthier Alvarez would have played in 34 games out of 60. He would have hit to a line of .279/.333/.654 with 14 home runs, 38 hits, and nine doubles. A solid season for only 34 games, and one that gets his counting stats that much closer to the ever-present round numbers coveted by baseball fans young and old. Adding 32 more games played to his career total, as well as 13 more home runs and 36 more hits could turn out to be just what Yordan needs should he be just below the mark come the twilight of his career.
Speaking of approaching the twilight of his career. To steal a line from another sport I follow very closely, “Mike Trout, you’re next!”
Main photo credits:
Matt Marton-USA TODAY Sports
Players mentioned: