Baseball Mythbusters: Greg Maddux and the 3–0 Count
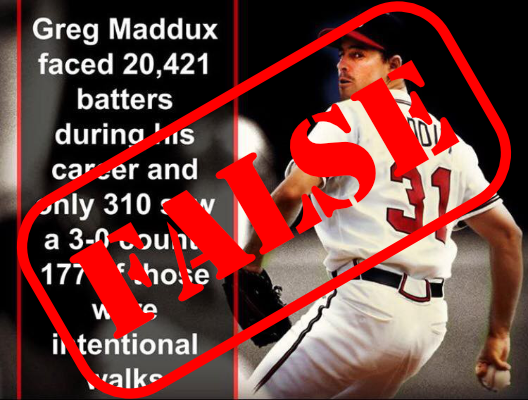
Hall of Famer Greg Maddux is one of the greatest pitchers of the Live Ball Era. One reason was his pinpoint control, with his ability to notch front-corner strikes leading to claims that umpires gave him a much wider strike zone than the rest of the league. Across his 23 seasons, he walked 999 hitters. His 4.9% walk rate is the second-lowest among Hall of Fame pitchers who pitched solely in the Live Ball Era (Robin Roberts, 4.7%). A popular meme says that out of the 20,421 batters Maddux faced in his career, only 310 saw a 3–0 count — and 177 were intentional walks. (Some versions say 133 instead of 310 and leave out intentional walks.) This statement further cements his reputation as a control artist. It’s mind-blowing. So mind-blowing, in fact, that it seems too good to be true.
That’s because it is.
In this installment of Baseball Mythbusters, we will look at Greg Maddux and the 3–0 count. We will see what makes this claim false, what the true number is, and the mistake made by the original creator of the meme.
Problems with the Greg Maddux 3–0 Count Claim
Problem #1: Incomplete Data
The first problem with the “310 batters faced a 3–0 count” claim is this: pitch count data is not available until 1988. Maddux made his debut with the Chicago Cubs in 1986, so we do not have any pitch count data for his first two seasons in the majors. This leaves 845 batters unaccounted for.
Maddux’s walk rate during those two seasons was 10.1%, more than twice as high as the rest of his career. Before signing with the Atlanta Braves prior to the 1993 season, his lowest walk rate for a season was 6.2% (1991). It dropped to 4.9% in 1993 and was only higher than 5% in one of his remaining seasons (2002). We can’t know for sure how many of the 1986-87 hitters faced a 3–0 count, but chances are good that the percentage is greater than or equal to his subsequent seasons in Chicago.
Problem #2: Incorrect Reading of His Splits
One of the most useful research tools on Baseball Reference is the Splits data. There are batting, pitching, and fielding stats available for every player on the site. They can be viewed by season or over an entire career.
One split for pitchers is “Count/Balls-Strikes.” This shows opposing batter stats in situations that can be grouped into three categories: plate appearances that ended on a certain count, plate appearances that go beyond a certain count, and plate appearances with certain miscellaneous characteristics. These miscellaneous characteristics include all counts with a certain number of balls or strikes as well as first pitch, pitcher ahead, count even, and batter ahead. There is also a line called “Unknown count” — there are 321 plate appearances where we don’t know what the count was on the final pitch.
Many see “3–0 count” and notice that there are 312 plate appearances (PA) — something the original meme creator might have rounded down to 310. This row, however, does not mean that there were 312 plate appearances that saw a 3–0 count. It means that there are 312 plate appearances that ended on a 3–0 count. In other words, the last pitch of the plate appearance came on a 3–0 count. In 293 of those, the batter walked; 153 were intentional. In the other 19, the batter put the ball in play. Seven of those 19 times, the batter notched a base hit; the other 12 times, the batter made an out.
Busting the Myth
To find how many hitters faced a 3–0 count against Greg Maddux, we must look at the row labeled “After 3–0.” This brings us to the correct number — 644. Keep in mind that this data only goes back to 1988, so we must adjust “batters faced” to 19,576 and intentional walks to 162. Doing the math shows us that only 3.2% of all hitters to face Greg Maddux from 1988 onward saw a 3–0 count, and one fourth of those were intentional walks. Wow.
So how many batters probably saw a 3–0 count in 1986 and 1987? As mentioned earlier, it is impossible to know. We can make a rough estimate, however, by using the count data from 1988 to 1990, which was the last season Maddux had a walk rate that was 7.0% or higher. In those three seasons, Maddux faced 3,060 batters, and 158 — roughly 5.1% — saw a 3–0 count. If we apply that percentage to the 845 batters he faced in his first two seasons, that makes 43.6, which rounds up to 44. However, since this is speculative, we cannot include that in the verdict.
Do not let the reality fool you — this is still nothing short of amazing. Let’s just make sure we’re using the right number when describing Maddux’s stats. Maddux was one of the best pitchers who pitched exclusively in the Live Ball Era. Only Warren Spahn (363 wins) had more wins than Maddux (355) during that era. Maddux is also one of only ten pitchers who has both 300 wins and 3,000 strikeouts. His control was so impeccable that Orel Hershiser once said Maddux “can throw a ball in a teacup.” The reality of Greg Maddux is amazing enough. There’s no need to add myths to the equation.
The Verdict
Myth: Greg Maddux faced 20,421 batters during his career. Only 310 saw a 3–0 count, and 177 of those were intentional walks.
Reality: Greg Maddux faced 20,421 batters during his career. Only 644 (that we know of; we are missing data for 1,166 batters) saw a 3–0 count — and 153 came on intentional walks.
Evan Thompson is a member of the Roland Hemond (AZ) Chapter of the Society for American Baseball Research (SABR). He is the author of A Complete History of the Major League Baseball Playoffs and has covered the Arizona Diamondbacks for Last Word on Baseball since 2019.