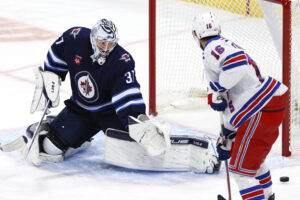
There’s a new tender in town, to help clean up the Senators crease. Will he improve the Senators goaltending standing from 2023-24? In order to understand how Linus Ullmark will fare in the Ottawa Senators net in 2024-25, we shall review some advanced stats. We will start by looking at some defensive team stats to show why the Boston Bruins were stronger than Ottawa. Next, we will look at the goalies’ numbers themselves, to understand why or why not Ullmark will be an improvement over Joonas Korpisalo.
Using Advanced Stats to Show Linus Ullmark Is an Upgrade
The consensus is that Boston had a much stronger defensive system last season than did Ottawa. But, can we paint that picture with the numbers? We previously did an article on this topic, where we more so focused on Ullmark’s numbers. This article is attempting to compare the teams. Therefore, one example, is if we analyze total shots against. In doing so, we may or may not actually conclude that Ottawa does better as a defensive unit.
| Level of Danger | |||
| Team | High | Medium | Low |
| Boston | 177 | 459 | 2215 |
| Ottawa | 185 | 448 | 2082 |
However, from the table it could the raise the bell for an alarming trend. That is, if Boston has so many more low shots against, but Ottawa has slightly more high chance shots against. Digging into those and other numbers, we do see some specific reasons for concern with Ottawa. From the stat rebound shots against, Ottawa allowed more with 229 to Boston’s 198. This could be a combination of things, such as Boston’s goalies not allowing rebounds as frequently. In contrast, the Bruins’ defence do a better job of clearing out front. Another aspect could be clear shooting paths and shot locations, as to why Ottawa gives up more rebounds. It definitely points to the defence somewhat if the team is giving up more shots, but a lower percentage of both high danger ones, and rebound shots.
The Team in Front of Linus Ullmark Will Need to Be Better Through Advanced Stats
For one explanation of this, we could turn to defensive zone giveaways. Ottawa had nearly 100 more over the course of the year, 356 to 260, than did Boston. Therefore, even on those potentially lower danger shots, if the goalies aren’t set, it doesn’t matter where they’re coming from in those instances. All told, Boston had a slight edge, no doubt influenced by the higher proportion of low danger shots, in expected save percentage on unblocked shots. Ottawa was .9386% and Boston’s was .9408. Conversely, what tells the tale of the tape, is the same metric, but in terms of being above expected. Boston’s goalies executed much better with a 1.19%, whereas Ottawa’s goalies struggled at -0.97%. Therefore, Boston was expected to save a higher percentage of shots than Ottawa and they executed on that expectation more often.
Turning to the Goaltenders’ Numbers
The last item to explore is whether it could have been a goaltending personnel issue or not. A couple stats to help paint the picture revolve around the save percentage on unblocked shot attempts. In terms of high danger shot attempts, Korpisalo actually performed quite well. His .788% was good for eighth in the league. As a comparison, of the two teams’ four main goalies total, Jeremy Swayman’s was next at .752%. The problem is, with so few high danger shots in the course of a season, as Ottawa surrendered the 185, as mentioned, it is difficult for it to translate into a significant impact on game outcomes. In contrast, where Boston’s goalies were better was the same stat, but for low danger shot attempts. Swayman was second in the entire NHL in fact at .976%. Ullmark was fifth at .971%. Conversely, for Ottawa, Korpisalo was 41st at .962% and Forsberg was 52nd at .956. Not strong enough in terms of league-wide ranks to be successful.
If we consider the impact, based on the numbers, we see why Ottawa struggled defensively and in net. If we imagine 2000 low danger shots throughout the course of a season, and if the differential is 0.01 as shown, that works out to 20 goals. That’s 20 goals from low danger opportunities, simply backbreakers for the team in front of you. In terms of the lack of impact of the improved high-danger opportunities, 0.03 of around 180 shots, is only 5.4. Then, this is further exacerbated by them giving up rebounds on a high-frequency on those high-danger opportunities, which just multiplies the effect. At the end of the day, you aren’t going to give up more shots, if the first or second one goes in off of a costly defensive zone turnover. Therefore, this could explain the negation of the effect of Boston giving up so many more low danger shots, but still have much better numbers for their goaltenders.
Last Word on Sens Podcast: Ottawa Senators Offseason with Charlie Arsenault
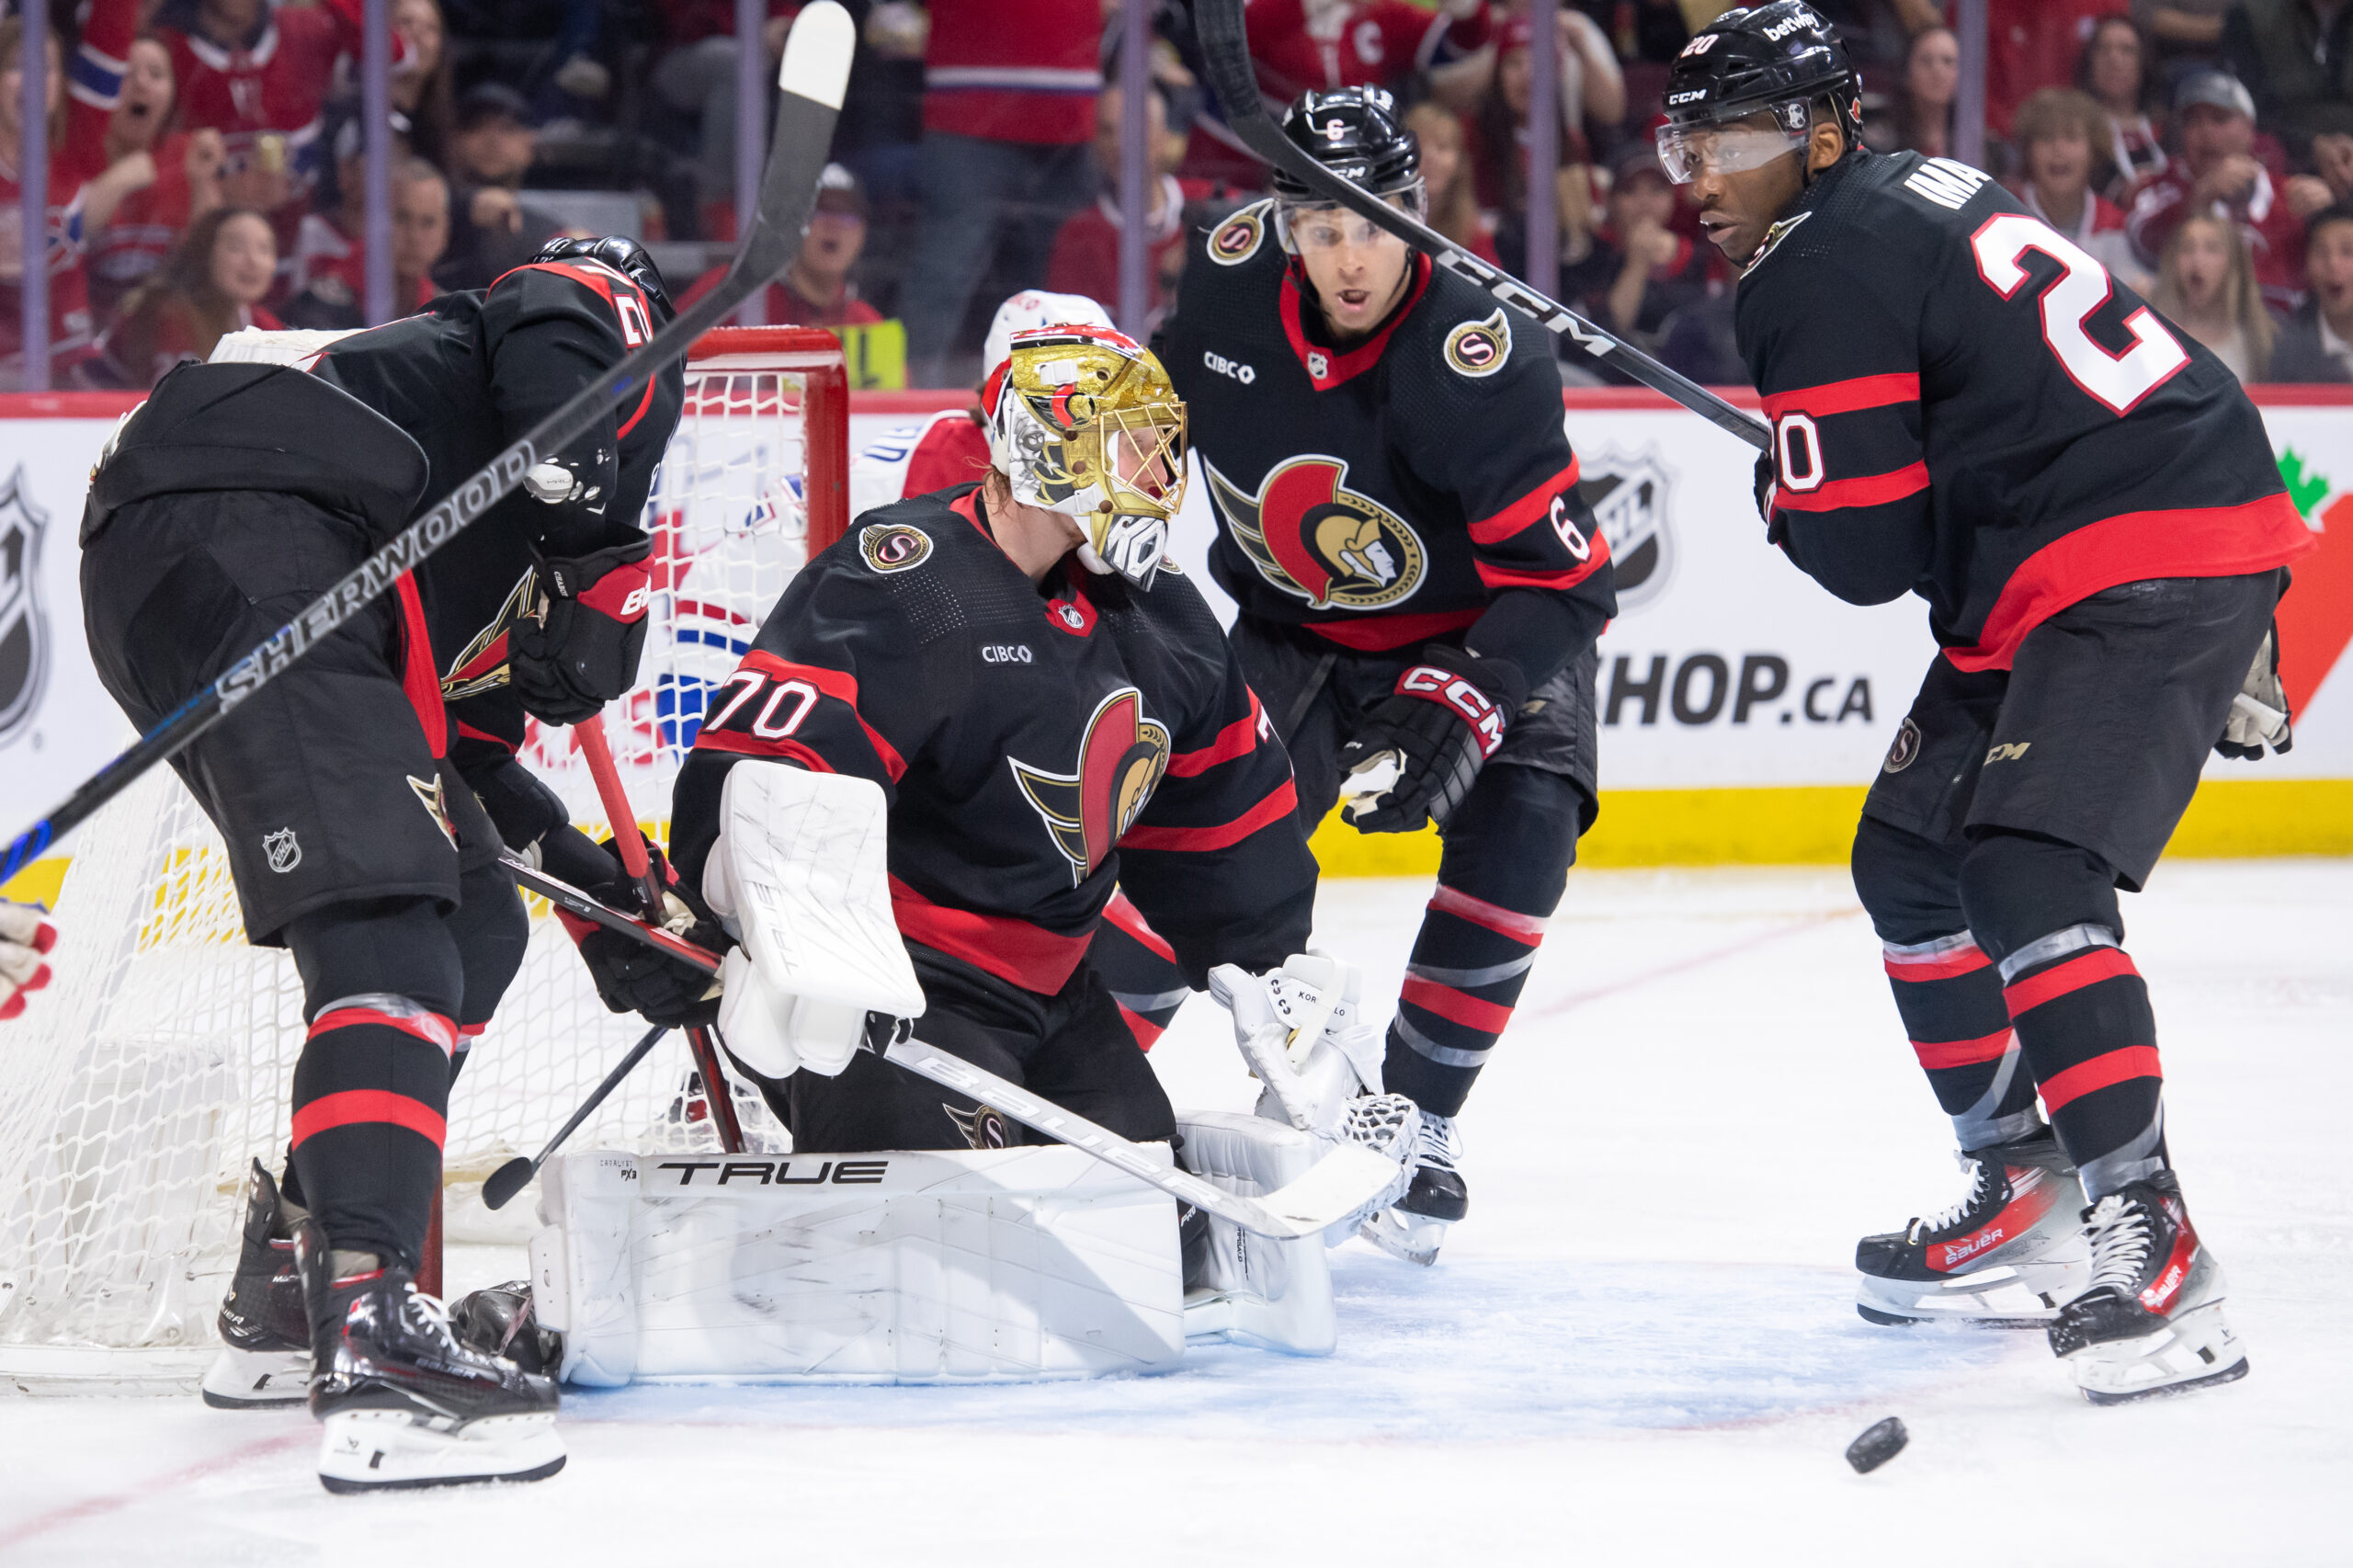
Main photo: Marc DesRosiers-USA TODAY Sports