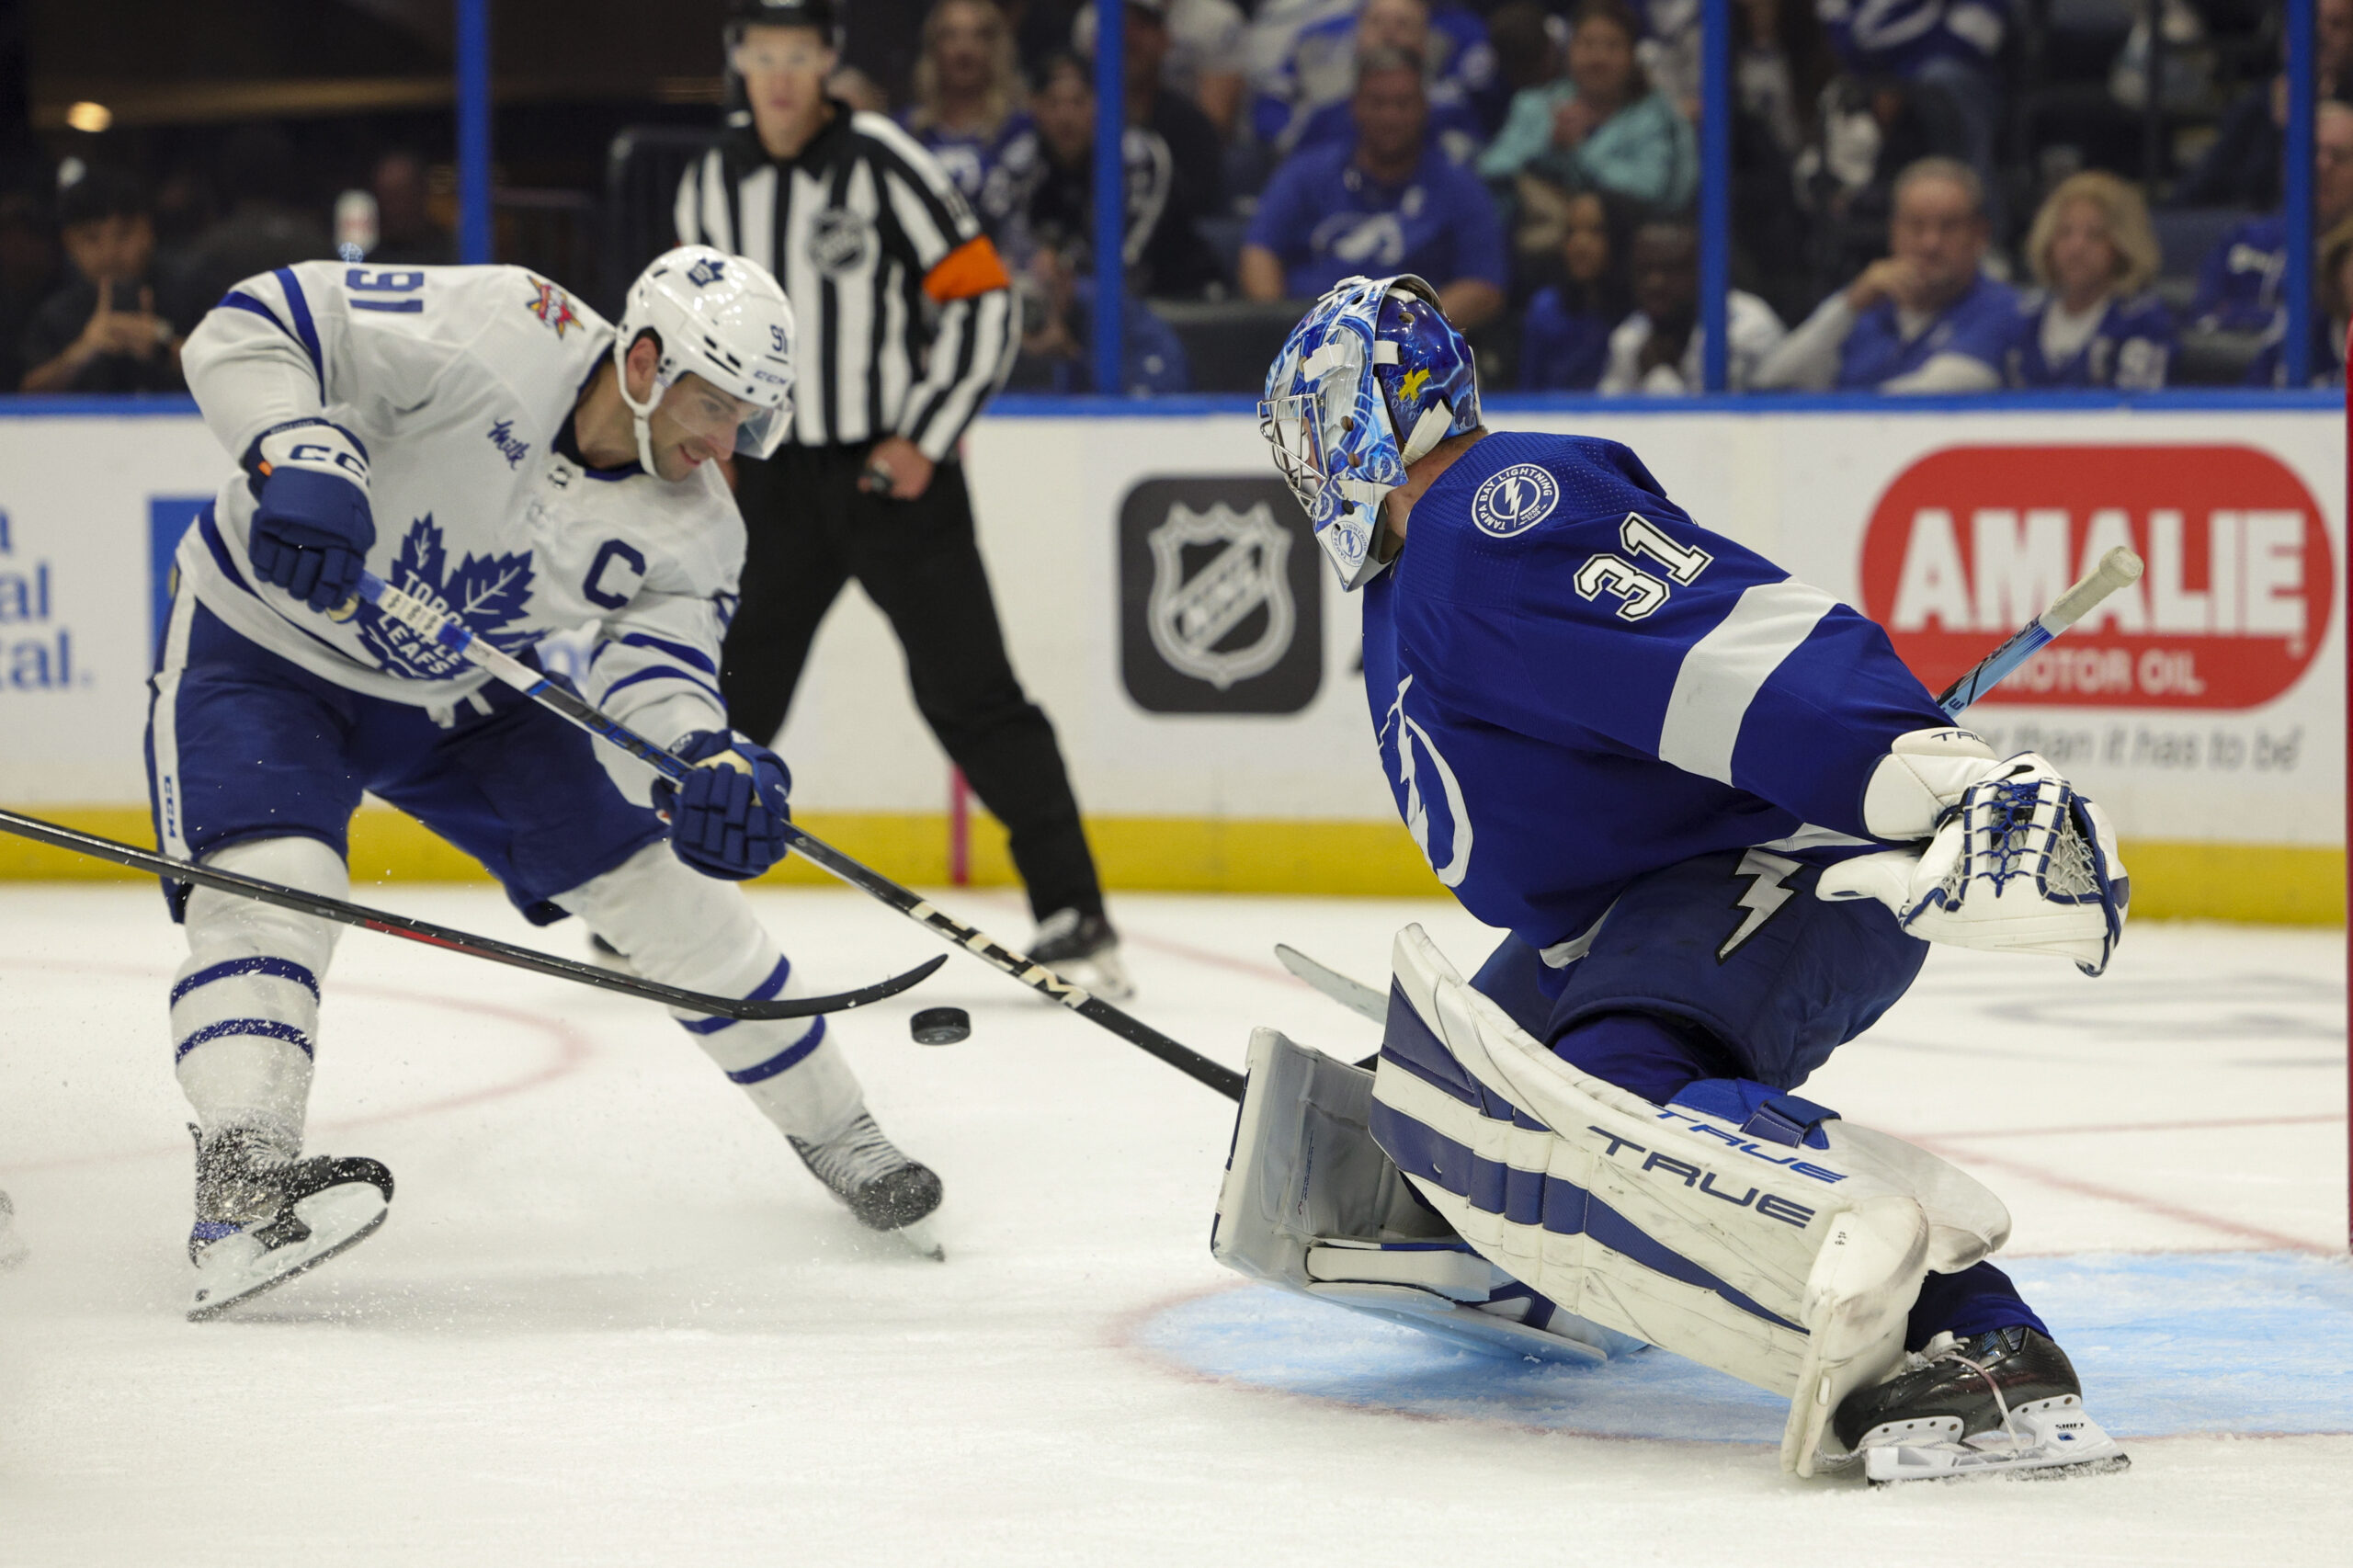
Tampa Bay Lightning goalie Jonas Johansson has not been the problem. Not in the slightest. Coming into the season, it was thought that the Lightning would be in deep trouble without their elite goaltender, Andrei Vasilevskiy. But that was quickly realized to be false; Johansson has been pretty solid in just about every start thus far. Despite that, the Lightning are still losing games that they shouldn’t be, in ways that are uncharacteristic. It has everything to do with their poor defensive zone coverage and mistakes with the puck in their own end.
Tampa Bay Lightning Goalie Jonas Johansson Not the Problem
Coming into the year, Johansson was looked at as a major risk, and was often called the “worst goalie in the NHL.” But this season, he has been really strong, despite being left out to dry often by the defenders in front of him. It has brought a new appreciation for Vasilevskiy, certainly. But it’s a testament to how much Johansson has managed to improve in short order for this opportunity.
According to Natural Stat Trick, the Lightning have allowed the fourth-most shots against per 60 this season (33.8) at five-on-five. They’re also fifth worst in expected goals against per 60 (2.91). Additionally, they’ve allowed the tenth most high-danger chances per 60 against (11.47). Yet, they’re in the top half of high-danger save percentage, thanks in large part to Johansson bailing them out on occasion thus far (0.855 HDSV%). But that isn’t all.
So far, per HockeyViz, Johansson has allowed 18 goals to 22.3 expected goals against (4.3 goals saved above expected). But the biggest thing is his performance thus far versus tipped shots. An article written before the season showed that Johansson struggled with traffic in front of him, especially when those shots got tipped. In fact, prior to this season, he allowed 14 goals to 7.9 expected goals in his career on tipped shots. This season, he has seen 27 tipped shots, and allowed three goals to 2.5 expected goals. That’s a big step forward for Johansson and in short order.
Tampa Bay Lightning Letting Down Jonas Johansson
Despite the considerable improvement statistically, and based on the eye test from “JoJo,” what else is going wrong? Short answer: turnovers. In-zone defensive turnovers more specifically. While this is taken from just two games out of the seven the Lightning have played, it’s still eye-opening. Thus far, with Kyle Pereira and Jack Pallotta’s tracked stats, Lightning defenders have combined for 200 defensive zone touches, and have turned the puck over on 38 of them (19% turnover rate).
Mikhail Sergachev leads the team on defensive zone turnovers with nine, while Nick Perbix has eight. On top of that, Perbix has just 21 defensive zone touches, meaning he has a turnover rate of 38.1% of his touches. That’s far and away the worst on the team, with the next worst being Haydn Fleury (30% on 10 touches vs. Detroit).
Meanwhile, the forwards have combined for 144 defensive zone touches, and 16 giveaways. That’s just an 11.11% rate, much nicer to look at. The most turnovers amongst the forwards is a tie between Nikita Kucherov and Luke Glendening at three each. But for Kucherov, he has 23 touches, almost double the next closest forward, and has a 13.04% turnover rate. In total, with the team combined, that’s 344 touches and a 15.7% turnover rate.
Compared To Last Season’s Tracked Stats…
Those stats really are meaningless without something to base it off of. Is 15.7% really that bad? How bad is it? Well, let’s compare it to last year. Last year, in 12 tracked games, the Lightning defenders combined for 846 touches and 140 giveaways (16.55% rate). Meanwhile, the forwards combined for 583 touches and 78 turnovers (13.38% rate). So, the forwards are doing better, with the obvious idea of sample size as a caveat, but the defence has been worse with turning the puck over.
Sergachev led the team in turnovers last season with 25, while Haydn Fleury had the highest turnover rate, at 26.83%. As for Perbix, he had 24 turnovers (second most amongst defenders) on 108 touches, for a 22.22% turnover rate (third worst amongst defenders).
The turnovers need to stop, but unfortunately, it seems like it’s the same culprits from last season.
Reasons For Optimism
The basis of this piece is Tampa Lightning goalie Jonas Johansson and how he has not been the problem. That’s why there is optimism guys. The person every single Lightning fan was worried about, the one who would eat all the criticism of every loss and garner none of the praise for every win, has become someone the entire fanbase has begun rooting for. That’s a positive. If Johansson can keep up the excellent work he has displayed in almost every single game this season, the Lightning can find some grounds on which to build forward.
It starts with the defensive zone structure. This is a new scheme, called “box+1”.
As @FriedgeHNIC said in 32 Thoughts…Looks like both #Oilers and #TBLightning are switching to a “Zone” or “Box + 1” D-Zone like Vegas used to win the cup!
You can see when the puck goes low to high, D1 returns to the net and F1 Holds Middle Icehttps://t.co/NGVh2pkxIR pic.twitter.com/5zGwVqAX4T
— Andrew Brewer (@Abrew2014) October 11, 2023
It’s clear this change in structure has made last season’s issues magnified early on this year. Hopes are, that the defenders can get comfortable within this system and start finding more success. Here’s to hoping that maybe all the Lightning needed is just a little bit of time to find a foothold. And if Johansson can keep putting them in positions to win, they can reclaim their spot closer to the top of the Atlantic Division.
2023-24 tracked stats via Kyle Pereira and Jack Pallotta
2022-23 tracked stats via Kyle Pereira
Goalie stats via HockeyViz
Shooting/Chance stats via NaturalStatTrick
Main Photo: Nathan Ray Seebeck-USA TODAY Sports


