Over the last several years, Last Word has been working on a study for NHL player development. In that time, there have been individual profiles for first round draft picks, specifically forwards. Those pieces split up forwards drafted out of the North American leagues (USHL, NCAA, CHL, etc.,) and European leagues (KHL, Liiga, SHL, etc.,). There’s even a piece breaking down first-round draft picks. But that just highlights the micro aspect of the player development details, rather than the macro. Things like patterns start to develop when you look at the sum of the parts as opposed to the individuals.
Ice Time and Its Impacts On NHL Player Development
The biggest pattern that arises when looking at player development is ice time. How important is it to give players time? Should teams ease their young players in? Is it important to throw the young kids to the wolves and let them fend for themselves? Should coaches be tough, and make the players earn their roles? Additionally, after their entry-level contract years, or in this experiment, their first three seasons after playing 15 or more NHL games in a single year, did tough love work? Or was it best to coddle to the young players and give them a big role immediately?
On the surface, one would guess giving a player a lot of ice time will lead to that player finding success, especially on the score sheet. While that may be true, there are things to be considered. For one, if a player struggles in his own end, do you want him playing a ton of minutes, likely against an opponent’s best players? That’s the struggle coaches face, but for today, let’s just focus on the impacts of ice time.
How Ice Time Correlates To Career Success
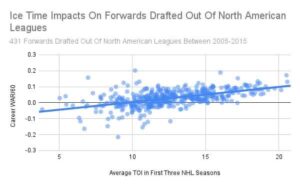
Doing this study, Last Word looked at every single forward drafted between 2005 and 2015 (1,037 total forwards) and separated out the ones who made the NHL (15+ games in a single season). That means that this project for ice time covers 545 players. Taking all 545 players (forwards!) and manually inputting every player’s first three NHL seasons ice times, then averaging it out, it was sorted from biggest role to smallest role. At the top, it was Sidney Crosby at 20.58 (~20:35 per game). At the bottom, it was Blair Jones at 3.85 (~3:50 per game).
Once that was done, it came down to finding a stat that could best measure a player’s overall talent. It was decided that, for this project, it was best to use Evolving Hockey’s Wins Above Replacement per 60 minutes (WAR/60) model, giving every player an even-playing field. Now, for some players, their careers started after 2007 (when the stat started being tracked), but most players were fully covered.
Finally, using a player’s career WAR/60 stat and averaging out their ice times within their first three seasons, we needed an equation to find the correlation between more ice time equating to better results. For that, this writer chose the correlation coefficient equation (to save time, it won’t be explained further, but if you’re interested, click the link here).
The Results
Ignoring where players were taken in the draft, or even what leagues they came from (Europe or North America), there was a moderate correlation. That correlation was 0.5394, landing it squarely in the moderate correlation range (0.5-0.7). Effectively, what that means is ice time matters a whole lot in regards to having future success, but is not the be-all, end-all. In other words, it is correlation, not causation.

Giving a player a lot of ice time does not guarantee that that player will inevitably have success. Does it give them better odds of panning out? Absolutely. But that’s it. For example, if you give Pat Maroon the same role as Nikita Kucherov, he isn’t magically going to perform at an elite level.
Now, there are outliers, and this is looking at the whole. WAR/60 has some players that stick out, such as Michael Bunting having a better career WAR/60 than Connor McDavid. Then there are players such as Tomas Hyka, Zach Hamill and Eric Wellwood having really strong WAR/60 stats, despite not exactly having the best of careers. Additionally, it’s no secret that first-round picks are likely going to perform better than seventh round picks, naturally. So, what does the correlation look like round-by-round? Also, what about the difference between players drafted out of European leagues versus North American leagues?
Ice Time Impacts For Specific Groups And Their NHL Player Development
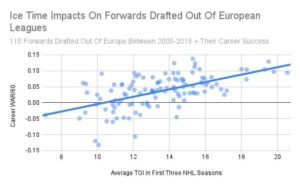
Of the 545 forwards drafted, 430 were drafted out of North American leagues and 115 were drafted out of Europe. For the 430 players drafted out of North America, the correlation coefficient landed at 0.5311, once again landing in the moderately correlated range. As for the forwards drafted out of Europe, they landed at 0.5688. That means that there really isn’t a very large difference. But what about individual rounds?
There were two different outcomes when breaking the forwards up into the seven different rounds they were drafted in. There were three rounds that landed in the “moderate correlation” grouping. Those rounds were the first (0.5883), third (0.6539), and seventh (0.5081) rounds. The other four rounds landed in the “low correlation” grouping (0.3-0.5). Those rounds included the second (0.4532), fourth (0.4356), fifth (0.4982) and the sixth (0.3283) rounds. In other words, it’s a weird mixture, and outside of a few outliers, there isn’t much in the way of variance between rounds to warrant a ton of attention.
Probabilities Of Success Using Ice Time
It is clear that there is some semblance of correlation between ice time and the success of players. That said, albeit again, there are outliers, and it should be noted that ice time is not the be-all, end-all. However, due to the fact that there is that pattern of correlation, can it be predicted, based on historical evidence, where a player may just end up based on their roles early in their careers?
The answer is yes. To do that, first split the 545 players into four categories: players who averaged well-above average ice time (roughly more than 14:49 time on ice per game) in their first three NHL seasons, above average ice time (roughly between 12:49 and 14:48 per game), below average ice time (roughly between 10:49 and 12:48), and well-below average ice time (roughly less than 10:48).
The Results
Players who landed in the well-above average category wound up landing in the “elite” section 39.42% of the time. The next closest results for the well-above average players was “Top-6 Calibre” (37.23%), followed by “Middle-6 Calibre” (25.55%), “Bottom-6 Calibre” (16.06%) and “Fringe NHLer Calibre” (5.11%). Meanwhile, for the above average group, their top outcome was a tie between “Top-6 Calibre” and “Middle-6 Calibre” at 35.04%. The next closest, in order, was “Bottom-6 Calibre” (23.93%), “Elite” (13.68%), “Fringe NHLer Calibre” (11.97%) and “Non-NHL Level Player” (3.42%).
Once you move over to the below average and well-below average groups, the discrepancy in results becomes even more clear. For below average, the top outcome is a tie between “Middle-6 Calibre” and “Fringe NHLer Calibre” at 29.63%. Following closely behind is “Bottom-6 Calibre” (27.16%), “Top-6 Calibre” (23.46%), “Non-NHL Level Player” (12.96%), and “Elite” (8.64%). Meanwhile, well-below average’s top outcome is “Fringe NHLer Calibre” at 33.33%, followed by “Non-NHL Level Player” (28.68%), “Bottom-6 Calibre” (20.16%), “Middle-6 Calibre” (19.38%), “Top-6 Calibre” (9.3%) and “Elite” (6.98%).
*Scroll to the bottom to see the WAR/60 ranges for each sub-group*
Caveats To The Probabilities Listed
With everything, there are always outliers or some sort of caveat that can draw some credibility away from the project at hand. There are several things, but let’s focus on two: WAR/60 and the thresholds set for each sub-group (Elite vs. Top-6 Calibre, etc.,). As mentioned, there are outliers with the WAR/60 model. But not only that, there are several different sites who calculate WAR differently; there is no set algorithm to determine WAR. That said, it is a flawed stat, but still a reliable one; as it continues to improve over time, it will only become a stronger analytic.
Now, for the sub-groups, those who scored an 0.08 WAR/60 (or, landing in the “Elite” category) includes some players who are not regarded as truly elite, such as Connor Garland (0.114), Jake DeBrusk (0.098), and Marcus Foligno (0.092), among several others. Meanwhile, guys like Jakub Voracek (0.079), Jake Guentzel (0.064), and Carter Verhaeghe (0.039), among others, are largely underrated by this metric. So, again, it isn’t a perfect system. But, it is accurate enough to still say that the probabilities listed above are largely accurate, historically. Thus, things can still be learned from it to better develop players (hey New York Rangers, are you listening?).
Ice Time, Despite Caveats, Still Complements NHL Player Development
Regardless of the outliers and the flaws, it is no secret that a player will still play better with ice time rather than with none at all. It’s logical. Give a player time, he’ll be able to learn and grow along with the game. If you don’t give a player time against tough competition, that player may be unable to understand what needs to be improved in his game in order to adjust to higher talent. But, in case one needs quantitative evidence, that will be supplied. Using… economics?
In economics, to quickly summarize, there is something called cross elasticity. Using quantitative data, one can calculate whether ketchup is a substitute or a complement of mustard. Ketchup is a condiment, as is mustard, and the two are, obviously, substitutes of one another. So how can this idea be used in development?
Using ice time as the “price” teams pay for players (they’re taking time away from other players for that specific player, right?) and using WAR/60 as “demand” (when you play someone 20 minutes a night, you expect results, right?), one can put together the equation. Using the well-above average category and comparing it to the above average category, one would get the cross-elasticity of -0.038. In other words, they are complements. Ice time may not be the only reason, of course, but it is a big one. The proof is in the proverbial pudding.
(For those who want a better explanation of cross-elasticity, click here.)
Ice Time Is Not Everything In NHL Player Development
Now, obviously there are so many factors at play in the development of young players. Health and wellbeing, fitness, and raw skills, things that are not quantifiable, are at play here. Additionally, some players who may have not been given a big role early in their careers still have a chance to turn it around. Whether they change teams or simply take a little bit longer to find their stride. There are plenty of examples.
William Carrier is one of the players who landed in the well-below average group. He started his career with the Buffalo Sabres. He had an uninspiring rookie year, then was taken in by the Vegas Golden Knights. There, he didn’t show much in the two years that followed the switch. However, he has steadily improved over the last four years, with 25 points in 56 games last season.
The same can be said on the flip side; a player can receive a lot of minutes and fizzle out. Whether they get dealt to a new team and can’t fit in, or they simply just couldn’t maintain their role. Such an example is Anthony Mantha. He performed well in his time with the Detroit Red Wings. However, he has since had trouble fitting in with the Washington Capitals.
Ice Time Is Just The Tip Of The NHL Player Development Iceberg
But again, as mentioned, ice time is not everything. Outside of the things that cannot be taken as quantitative data (like health, wellness, and other intangibles), there are also impacts outside of ice time that are quantitative. That includes, but is not limited to, impacts of coaches (are said players coaches historically good/bad with younger players?), impacts of linemates, and many other things.
Additionally, there are other stats that can be just as reliable, if not more acknowledged as such, than WAR/60. Stats such as points per 60 minutes, goals for percentage, expected goals for percentage, and many more such stats are also well-respected. But this is just the beginning of this Last Word NHL player development project. Stay tuned for much, much more.
*WAR/60 Probabilities Sub-Groups: Elite (>0.08 WAR/60). Top-6 Calibre (0.04-0.079). Middle-6 Calibre (0.02-0.05). Bottom-6 Calibre (0-0.03). Fringe NHLer Calibre (-0.025-0.01). Non-NHL Level Player (<-0.026).*
WAR/60 stats from Evolving Hockey
Ice time from Hockey Reference
Data organized and gathered by Kyle Pereira
Main Photo: Jerome Miron-USA TODAY Sports